Motivation and Significant
The Global Navigation Satellite System (GNSS) is widely used in positioning, navigation and timing (PNT) purpose. The GNSS signal may experience rapid random fluctuations in the amplitude and phase, known as scintillation, when it passes through irregularities in the ionosphere. The scintillation degrades the accuracy in positioning and navigation application. Therefore, understanding scintillation is important for assessing the performance of a navigation system in the low-latitude region. Although most GNSS receivers are not equipped with the scintillation measurement through the S4 index, the rate of TEC change (ROTI) is normally used as an indicator to monitor the ionospheric irregularities. In [1-4], the correlation between ROTI and S4 index were studied, and showed the positive correlation. To study the local ionosphere, there are 2 condition to be considered: one is disturbed condition caused by equatorial plasma bubble (EPB) and the other is the quiet condition. In [1]-[3], the authors evaluated the relationship between ROTI and S4 index at Sanya, China, Polar region and Hok Tsui, Hong Kong, respectively indicating that the ROTI/S4 ratios are varied between 0.3 and 0.6. In 2021, [5] evaluated the relationship between ROTI and S4 index over low latitude station indicating in different seasons that the maximum correlation coefficient of 0.95. Obviously, the scintillation analysis over Thailand has not been well studied.
Objectives
In this research, we aim to analyze the amplitude scintillation that are derived the data from the GNSS receivers at Chumphon and KMITL, Bangkok Thailand. Moreover, we plan to analyze and predict the amplitude scintillation over Thailand for space weather forecasting and GNSS system.
Novelty: (Data, Algorithms)
Data that we use is in Thailand. (Low latitude)
Key Results
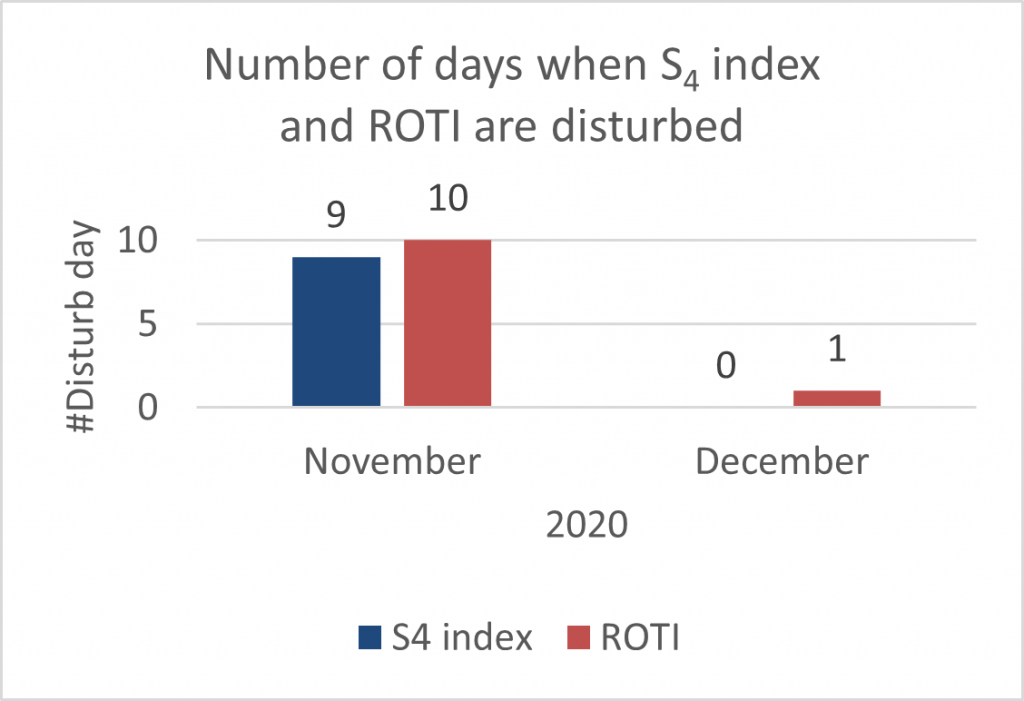
Fig. 1. Statistics of S4 index and ROTI between 11 November and 31 December 2020.
We preliminarily investigate the statistics of the disturbed days indicated by the values of ROTI and S4 index of 51 days from 11 November to 31 December 2020. From the results, we found that the disturbed days by ROTI and S4 index are about 21.57% and 17.65% of the total observed days, respectively. From above, sometime ROTI shows disturbances only, but not in S4 index. However, we can see the good correspondence between S4 and ROTI. In this case, the number of days in which both ROTI and S4 are disturbed is 9 days. Alternatively, we also compared the disturbed days indicated by S4 index from Beacon Receiver and it is also observed that the disturbances in S4 index from Beacon Receiver, but not in GNSS Signals. The result show amplitude scintillation mostly occurs below 550 km.
|
(a) |
(b) |
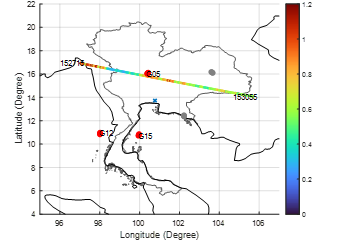
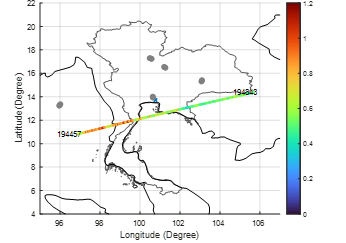
Fig. 2. Relationship between S4 index from GNSS receiver and Beacon receiver on DOY 80 2021 (a) when S4 index from GNSS receiver and Beacon receiver are disturbed (b) when only S4 index from Beacon are disturbed.
References:
- T.E. Humphreys, M.L. Psiaki, J.C. Hinks, B. O’Hanlon, P.M. Kintner, “GNSS and Ionospheric Scintillation How to Survive the Next Solar Maximum,” Inside GNSS, 2009.
- X. Pi, A.J. Mannucci, B. Valant-Spaight, Y. Bar-Sever, L. J. Romans, S. Skone, L. Sparks, G. Martin Hall, “Observations of Global and Regional Ionospheric Irregularities and Scintillation Using GNSS Tracking Networks,” Proceedings of the ION 2013 Pacific PNT Meeting, Honolulu, Hawaii, pp. 752-761, April 2013.
- Z. Yang and Z. Liu, “Correlation between ROTI and Ionospheric Scintillation Indices using Hong Kong Low-Latitude GPS data,” GPS Solutions, vol. 20, no. 4, pp. 815-824, 2015.
- C. Li, C.M. Hancock, N.A.S. Hamm, S.V. Veettil, C. You, “Analysis of the Relationship between Scintillation Parameters, Multipath and ROTI,” Sensors, vol. 20, 2877, 2020.
- N.A. Manga, K. Lakshmanna, A.D. Sarma, and T.K. Pant, “Analysis of Correlation between ROTI and S4 Using GAGAN Data,” Progress In Electromagnetics Research M, vol. 99, pp 23-34,2021