This quick-look ionogram is provided by FM/CW ionosonde at CPN station which is administrated by the research cooperation between SEALION project, Japan, and KMITL, Thailand.
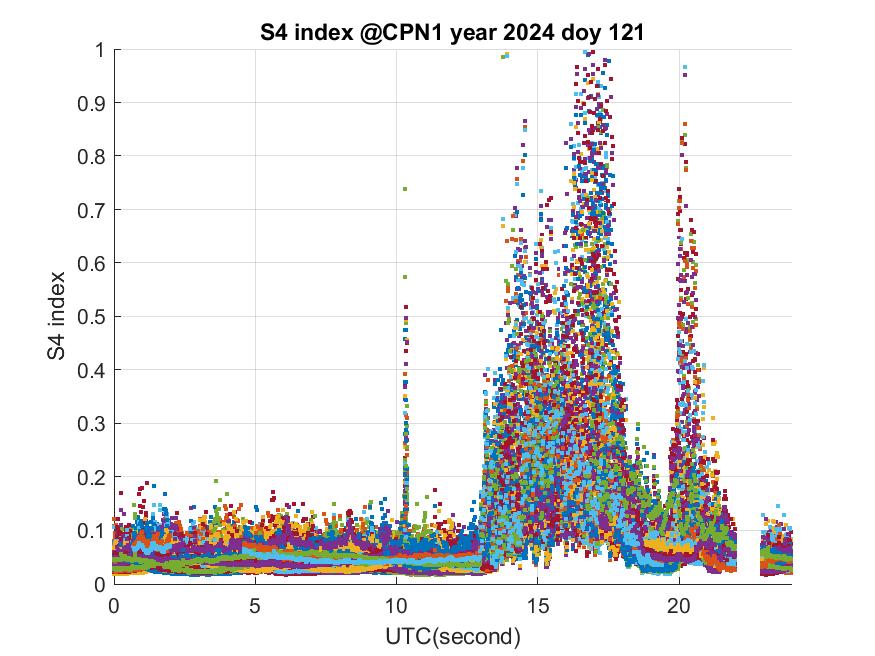
The slant TEC (STEC), absolute TEC values are computed from the dual-frequency GNSS receiver. Each color represents the calculated TEC values from different satellites.
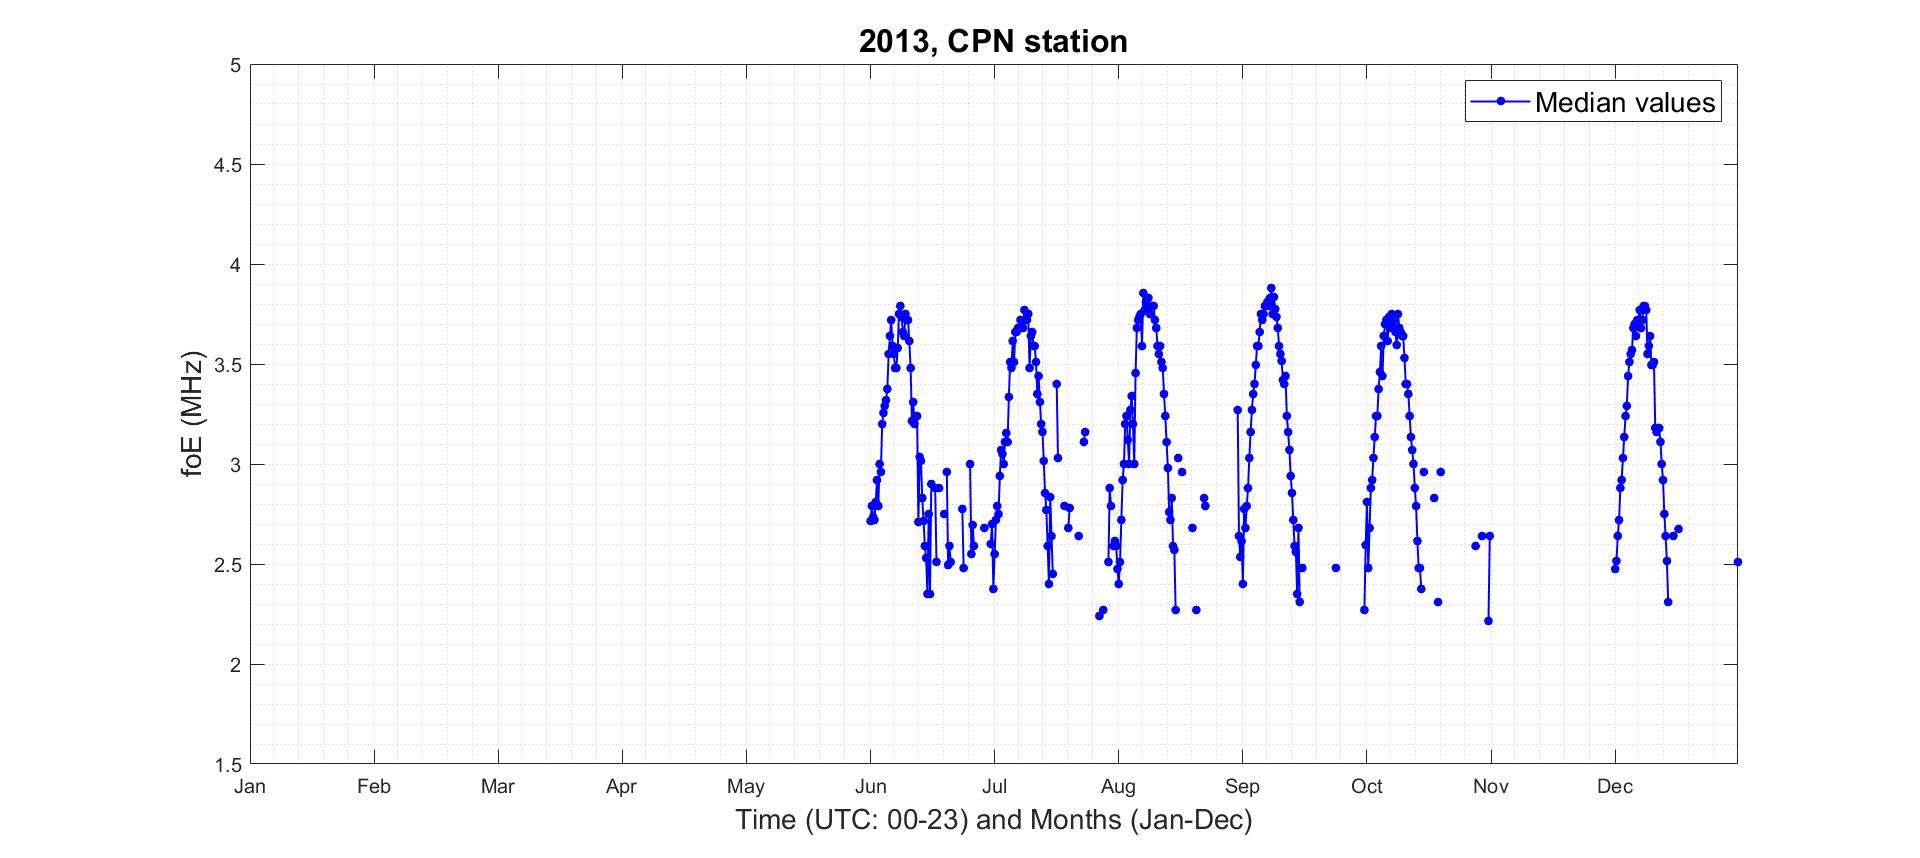
The peak frequency of the E-layer is called foE. The echo frequencies are received at FMCW ionosonde at CPN station by the reflection of radio waves with the ionospheric E-layer. The graph shows the statistics of median values of the foE against the universal time (00-23 hour) and months (January-December).
Critical Frequency of F2 layer (foF2)
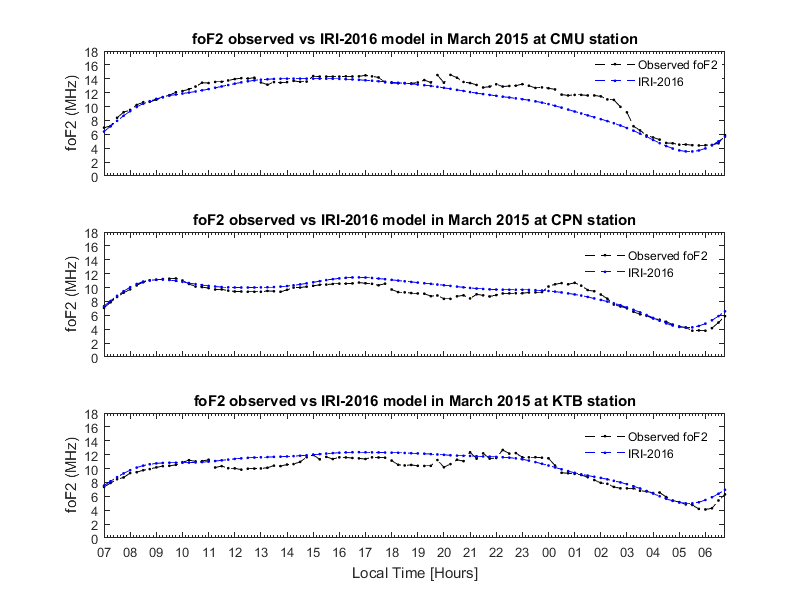
The critical frequency of the F2 region (foF2) is the maximum frequency which can be vertically refracted by the F2 layer. The graphs below show examples of the foF2 plots vs. local time from the FM/CW ionosonde observatory at Chiang Mai (18.8 N – 98.9 E), north of Thailand, Chumphon (10.72 N – 99.4 E), south of Thailand and Kototabang (0.2 N – 100.3 E) in Indonesia. The observations are compared with the foF2 results of a global prediction model (the IRI-2016 model).
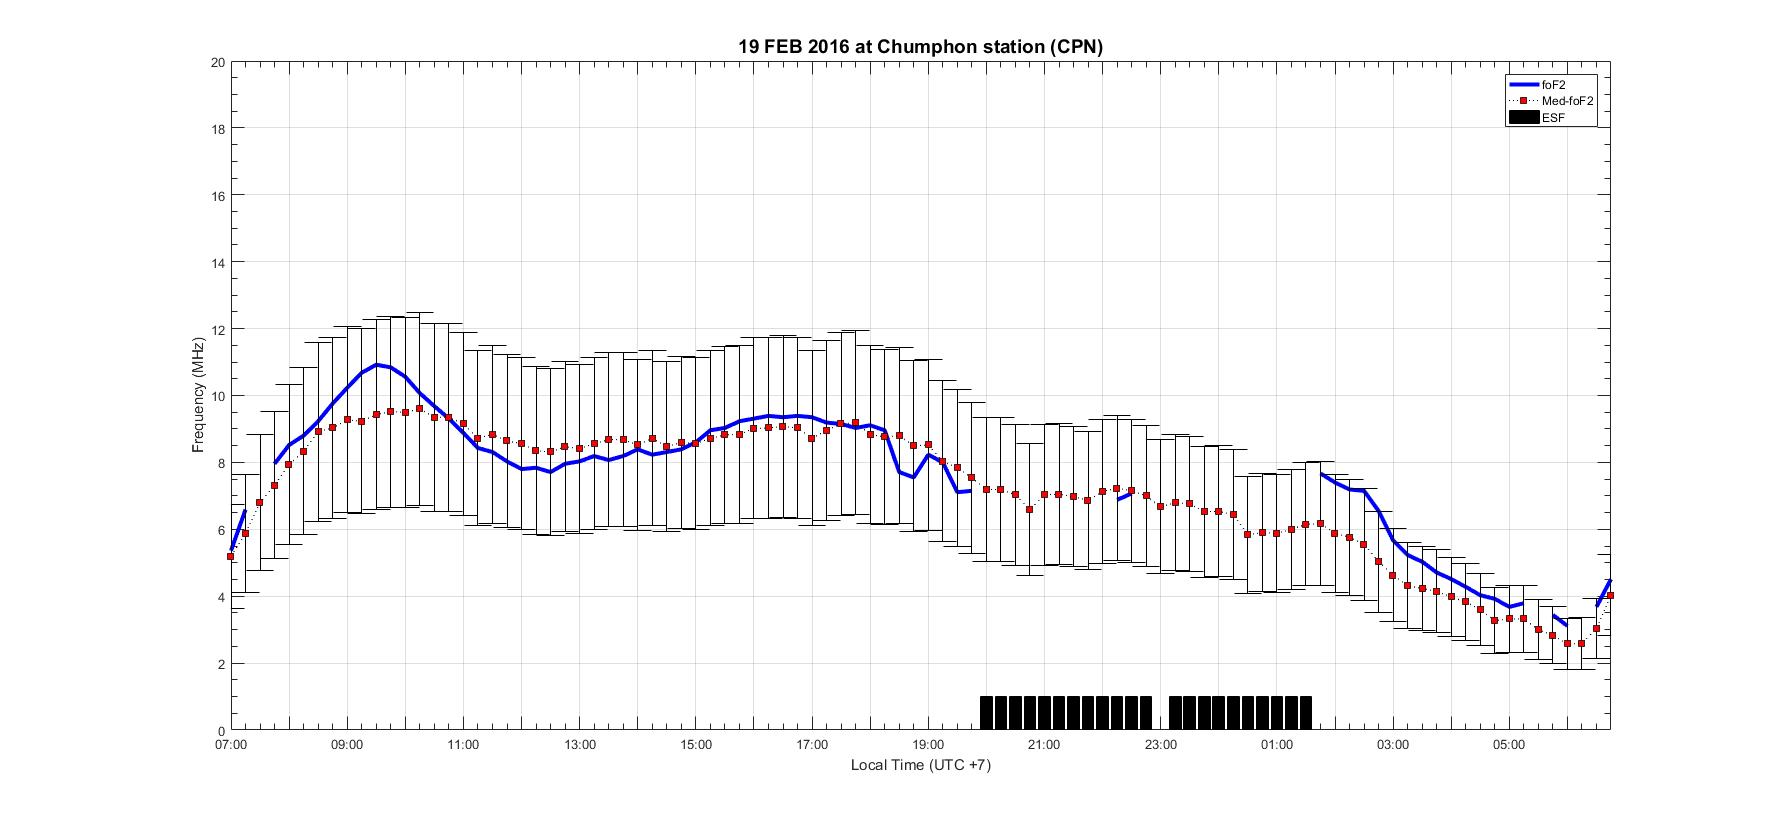
The monitoring of foF2 at Chumphon station
This monitoring exhibits the median value of foF2 as the graph with a red square, the blue graph is an observed foF2 value and the black color bar represents the equatorial spread-F (ESF). The real-time observation is coming soon…
The foF2 2D map using the data from the IRI-2016 model
The foF2 2D map is produced by utilizing the foF2 predicted data from the IRI-2016 model. This 2D foF2 map covers the latitudes (0 – 25E) and the longitudes (95 – 110N) over Thailand and nearby regions.
Spread F Statistics
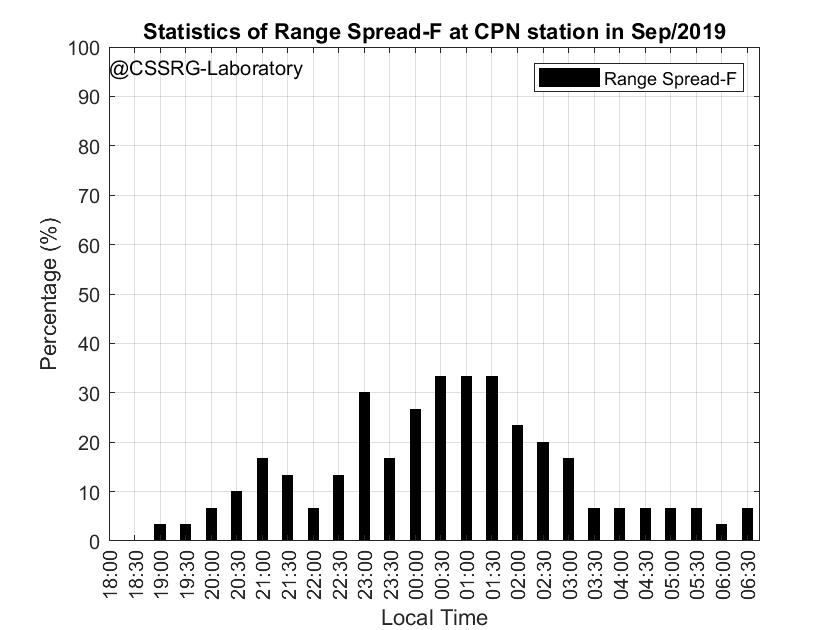
The spread F is an important parameter obtained from the spread of F trace on ionograms. Spread F occurrence at the equatorial region is typically due to instability of the bottom side of F2 layer after sunset. Various types of spread F include (1) frequency spread F (FSF), (2) range spread F (RSF), mixed spread F (MSF) and strong spread F (SSF), respectively. The spread F impacts the high frequency (HF) communications and navigation systems such as Global Navigation Satellite Systems (GNSS). Examples of spread F statistics at Chumphon station are shown below.
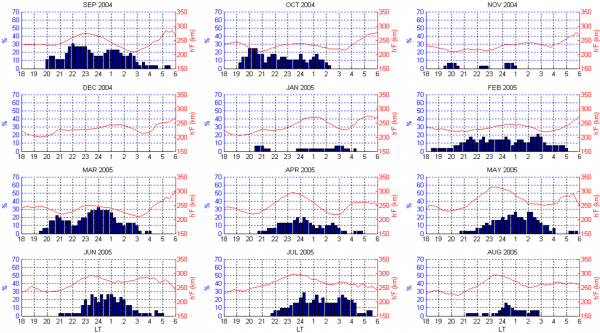
Chiangmai (CMU): 2004
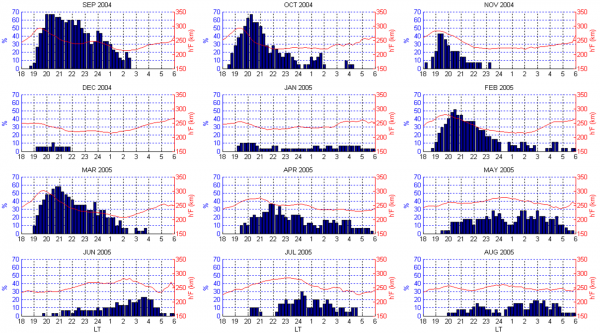
The ESF statistics and the virtual height of F layer (h’F) are observed by the FMCW ionosonde at Chiangmai and Chumphon stations in 2004. Where blue bar represents the monthly percentage of ESF occurrences and the red graph represents the h’F against the local time (UTC +7).
Chumphon (CPN): 2004
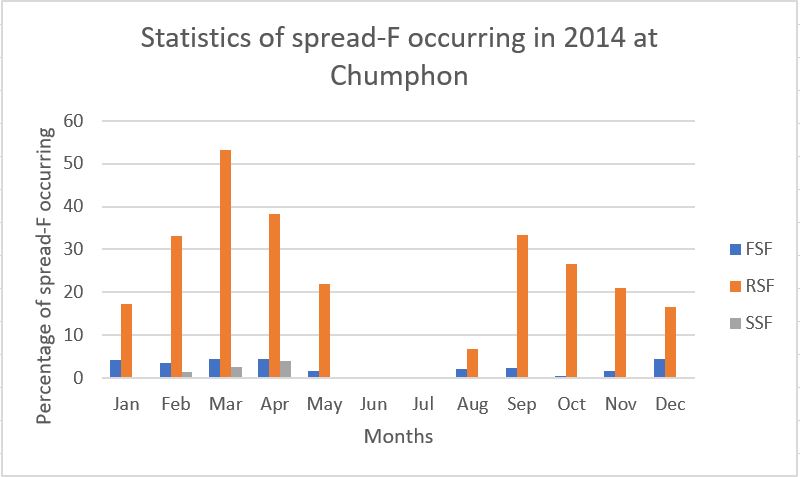
Chumphon (CPN): 2014
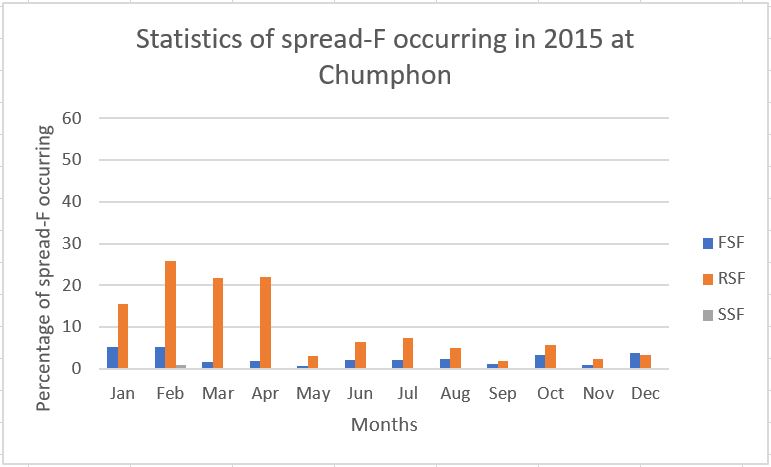
The statistical percentages are measured by FMCW ionosonde at Chumphon station from 2014 to 2015. Where blue bar, orange bar, and brown bar represent each different type of ESFs including FSF, RSF, and SSF, respectively.
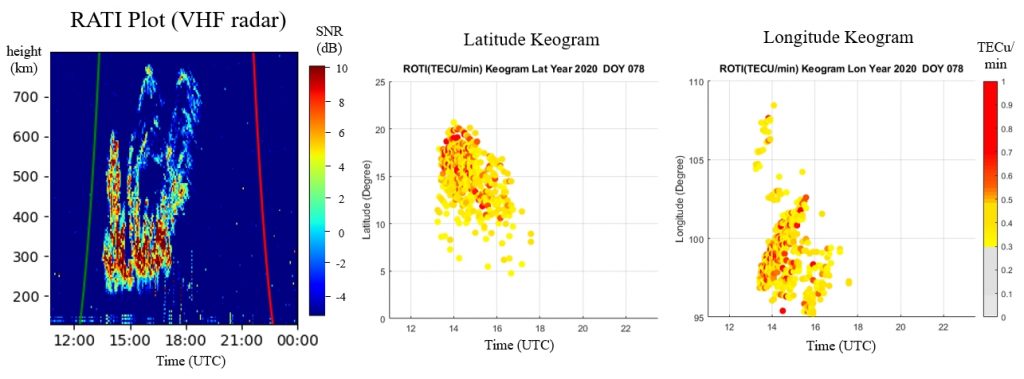
The VHF radar, which is located at KMITL of Chumphon Campus, Thailand, can scan using an F-region Field Aligned Irregularity or FAI Doppler observation beam with an altitude range of 300 to 500 km. The scanning in geomagnetic east-west direction within 1000 km. The VHF radar produces the echo images and Range-altitude-time intensity (RATI) graph.
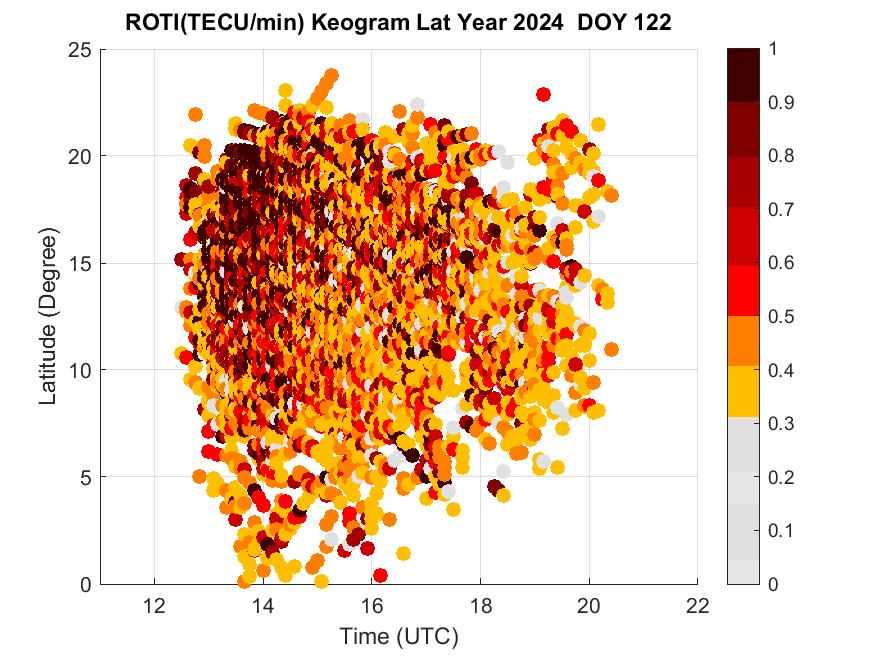
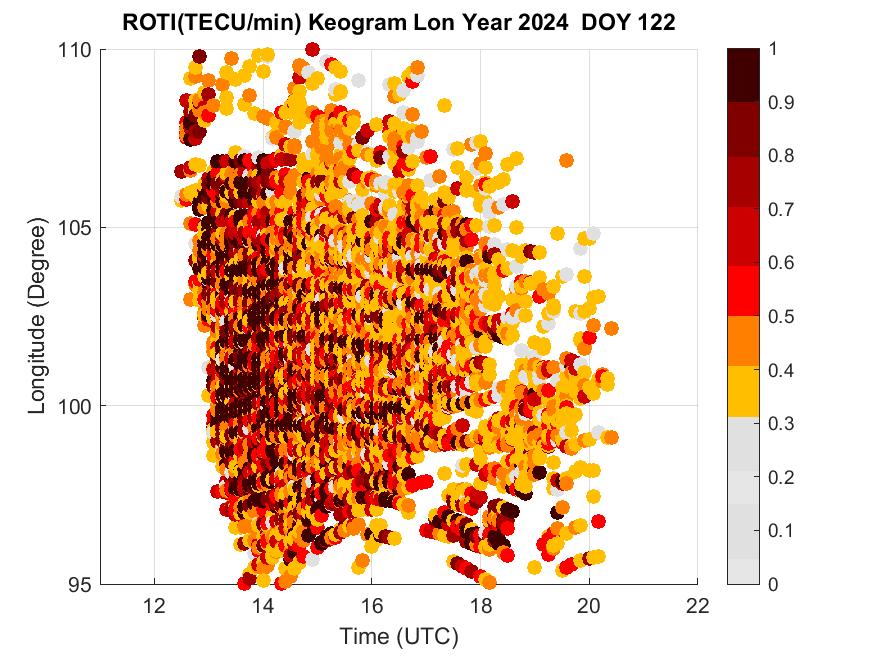
ROTI Keogram and RATI graph comparison (March 18, 2020)


 The monitoring of foF2 at Chumphon station