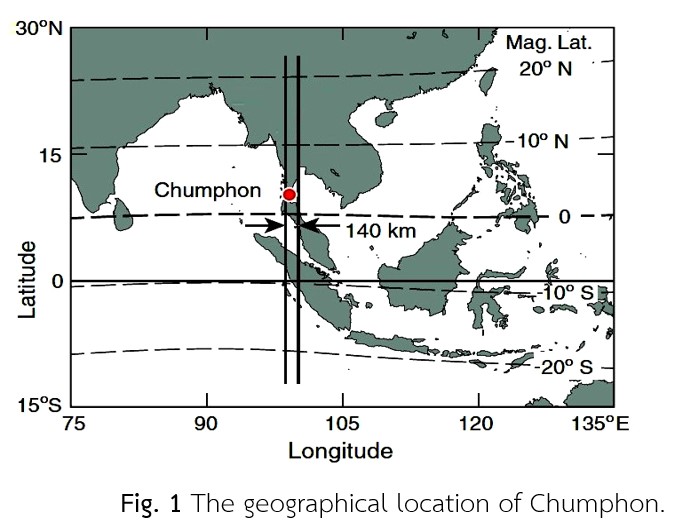
The Ionospheric Observation station Chumphon is located on the Chumphon campus of King Mongkut’s Institute of Technology Ladkrabang (geographical latitude 10.72°N, longitude 99.37°E; magnetic dip latitude 3.22°N) which is in the equatorial latitude zone as shown in Fig. 1. This station has the folloing instruments:
- FMCW Ionosonde transmitter and receiver (NICT)
- JAVAD GPS receiver (NICT)
- TOPCON GNSS receiver (JAXA)
- GNU radio beacon receiver (GRBR) Beacon receiver (Kyoto University)
The FMCW ionosonde station is one of the eight stations under SEALION (South East Asia Low-Latitude Ionospheric Network) project. It is a joint project under National Institute of Information and Communications Technology (NICT), Japan, and collaboration with partnered institutes and universities mostly in ASEAN region.
 |
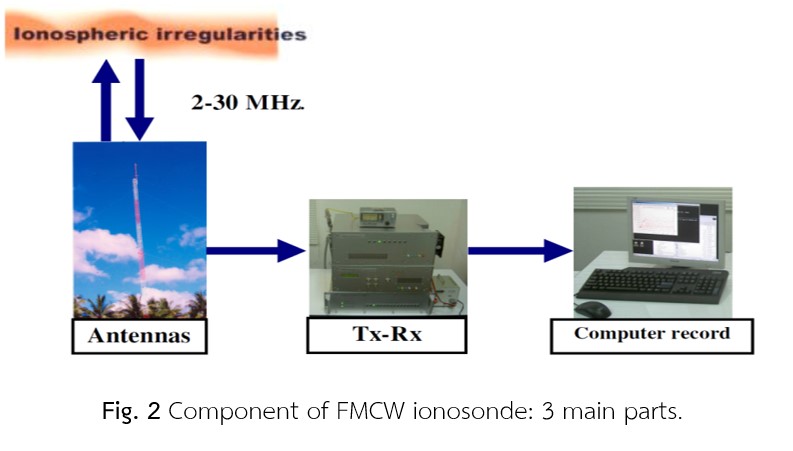 |
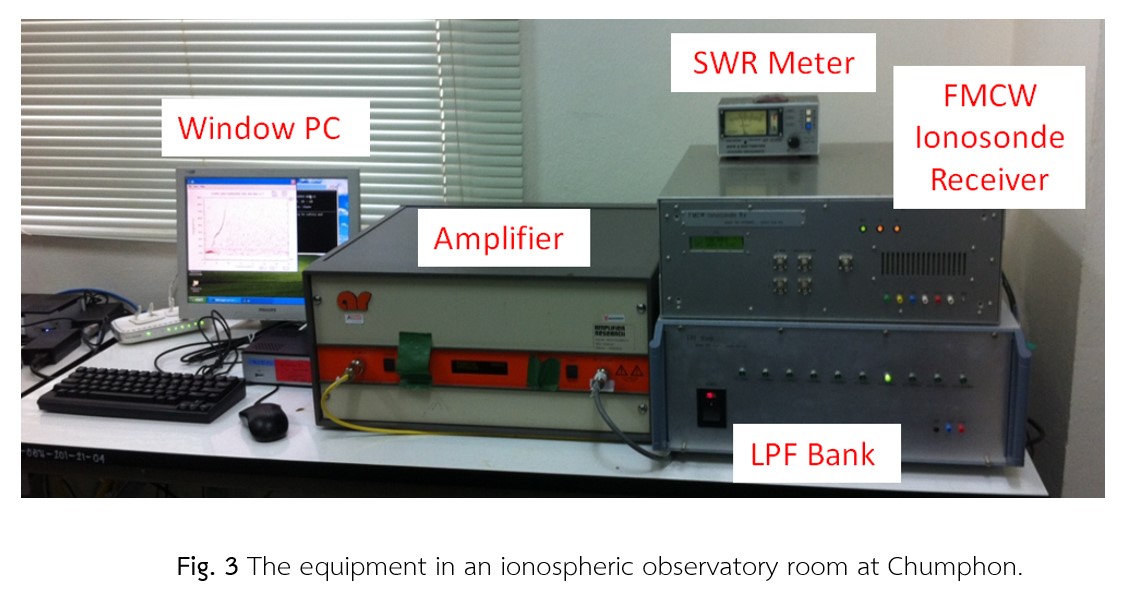
- FMCW ionosonde
FMCW ionosonde is a measuring instrument which is based on the “Ionosonde” technique for monitoring the Ionosphere. Another name of FM/CW ionosonde is ionospheric sounder. The main component of ionosonde consists of 1) Antenna 2) transmitter and receiver, and 3) computer as shown in Fig. 2. Figure 3 shows the equipment in an ionospheric observatory room at Chumphon including an amplifier, an LPF bank, an FMCW ionosphere receiver, an SWR meter, and a window PC.
 |
 |
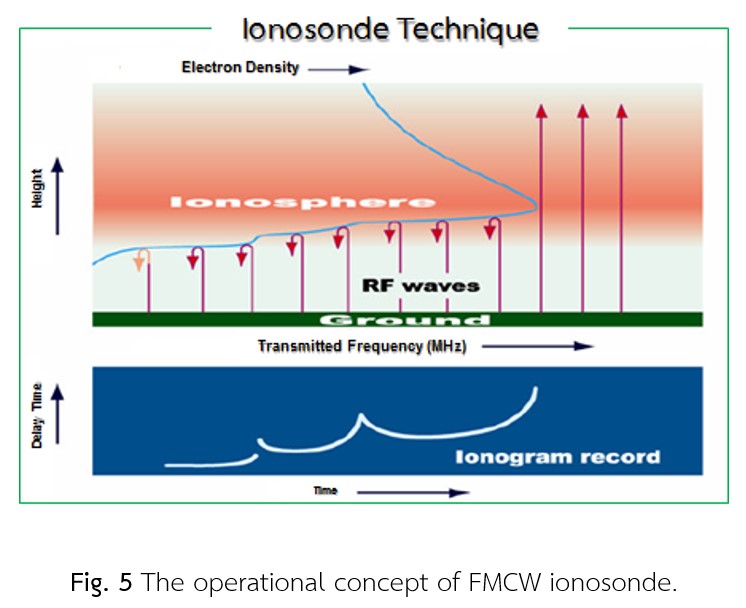
An ionosonde used at Chumphon station transmits FM-modulated signals to reflect from the ionosphere layer using the frequency of 2 to 30 MHz (high frequency or HF) and receives the echoes continuously, so called “continuous wave-frequency modulation (FMCW) ionosonde”. The HF signals are increased with a sweep rate of 100 kHz/s and a sweep repetition period of 5 minutes. Figures 5 and 6 show the operational concept and the traces with their main parameters of the FMCW ionosonde, respectively.
 |
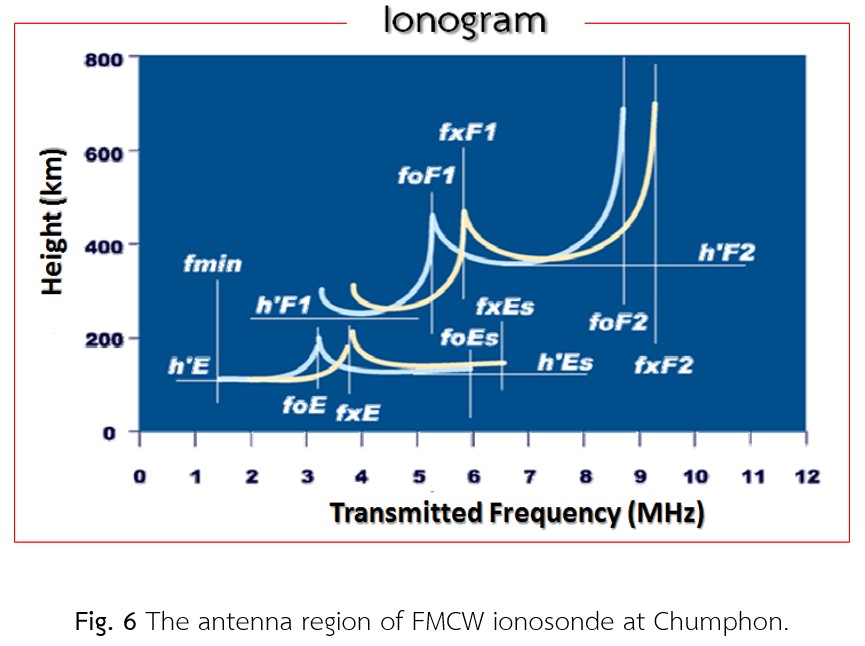 |
The FMCW ionosonde has been routinely used to monitor the ionosphere till now. Its traces are called ionogram and recorded in a computer at every 5 minutes. These ionograms can be scaled manually or automatically to obtain some ionospheric parameters [1], for instance, the virtual height of E, Es, and F layer (h’E, h’Es, h’F), the plasma (critical) frequency of E, F1, and F2 layer (foE, foF1, foF2), and the maximum usable frequency at distance 3,000 km of F2 layer <MUF(3000)F2>. Moreover, we can also compute other ionospheric parameters at Chumphon which are based on the empirical equations, for example, the F2 layer peak electron density (NmF2), the F2 layer peak electron density height (hmF2), and the equivalent slab thickness (EST or t).
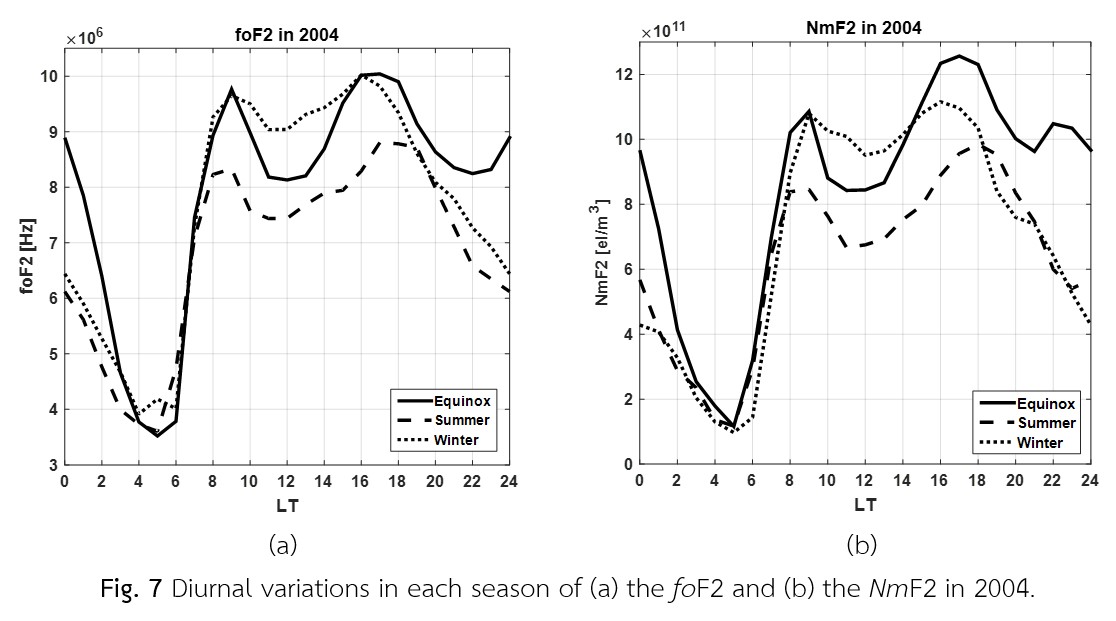
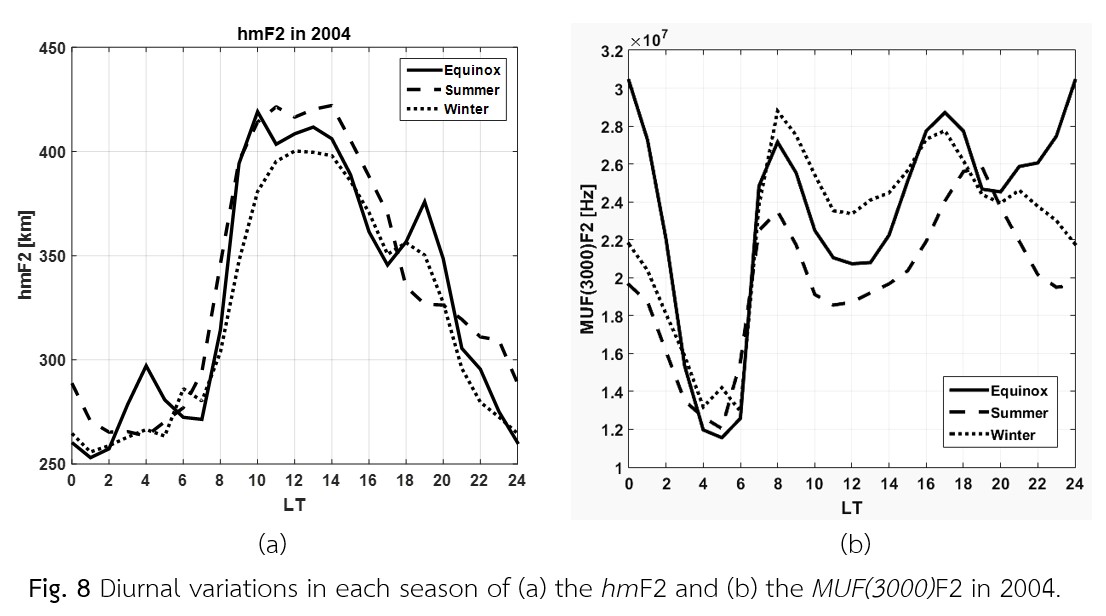
The examples of diurnal variations of the foF2 and the NmF2 in each season of 2004 (minimum solar activity of solar cycle 23th) are shown in Fig. 7. Meanwhile, the examples of diurnal variations of the hmF2 and the MUF(3000)F2 in each season of 2004 are shown in Fig. 8. Note that these measured data are grouped into three seasons: equinox (March, April, September, October), summer (May – August) and winter (November – February). The 12-month running mean relative sunspot number (Rz12) in 2004 is equal to 51.16. In each figure of Fig. 7 – 8, the x-axis is the local time (LT) and the y-axis is the hourly median of the scaled or computed parameters.
 |
 |
- JAVAD GPS Receiver
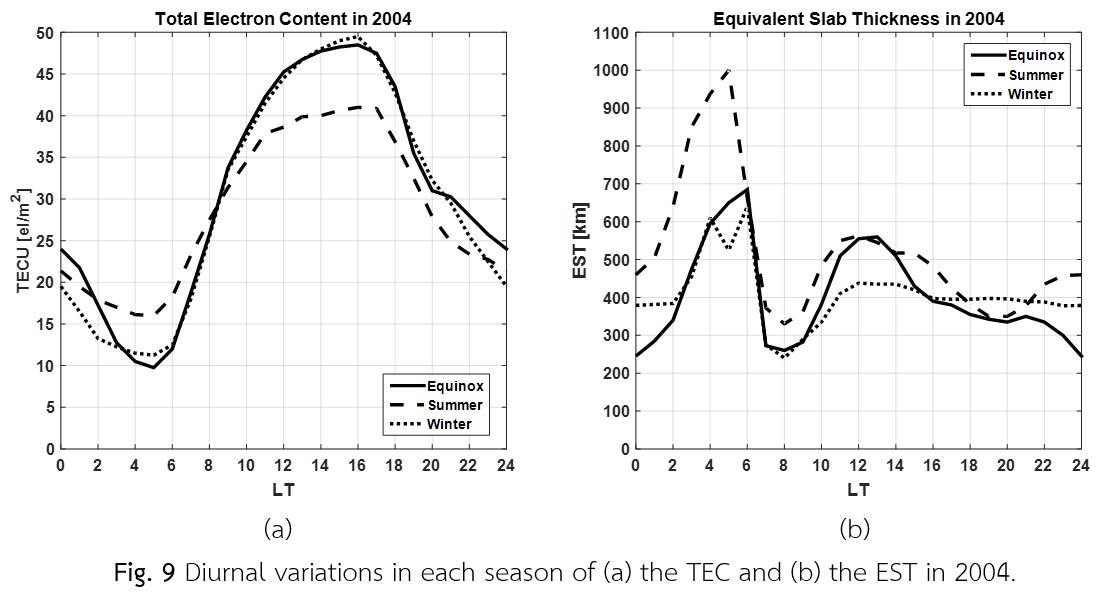
At the ionospheric observatory station, Chumphon, a JAVAD GPS system is also monitored to compute the total electron content (TEC) in ionosphere and plasmaphere. The JAVAD GPS system is a dual-frequency (f1 = 1575.42 MHz and f2 = 1227.60 MHz) GPS system which is composed of an antenna, an amplifier, a JAVAD TEC meter with a GPS receiver, and a computer. The GPS receiver embedded in the JAVAD TEC meter receives the GPS signals continuously and computes the slant TEC (STEC) between a satellite and a GPS receiver. The STEC can be calculated from the difference between the pseudoranges (P1 and P2) or the difference between the phases (L1 and L2) of two frequencies [3]. The STEC is computed continuously by mitigating the receiver bias, the satellite bias, and the cycle slips. Afterward, the STEC is converted into the Vertical TEC (VTEC) [2]. The VTEC can be used in many practical applications, for example, the ionospheric time delay of GPS signals, the equivalent slab thickness, etc. Note that the raw data (as a RINEX file) obtained from GPS satellites is stored in a computer. The STEC is defined as the line integral of the electron density from a GPS satellite to the GPS receiver above a specified elevation angle and the VTEC value (unit: el/m2) is the TEC in a vertical column of 1 m2 cross section. The equivalent slab thickness (EST) in ionosphere is a ratio between the VTEC and the NmF2 [3]. The examples of diurnal variations of (a) the TEC and (b) the EST in each season of year 2004 are shown in Fig. 9.
 |
References
[1] Wakai, N., Ohyama, H., Koizumi, T., 1987. Example of typical ionogram. Manual of Ionogram Scaling. Third Version. Communications Research Laboratory, Tokyo, Japan.
[2] Blewitt, G., 1990. An automatic editing algorithm for GPS data. Geophys. Res. Lett. 17, 199-202.
[3] Ma, G., Maruyama, T., 2003. Deviation of TEC and estimation of instrumental biases from GEONET in Japan. Annales Geophysicae 21, 2083-2093.